Chi Square Test Guide — First Simple and Humane Explanation

Chi-squared test is a demonstration of why research methods in academia are more intense than Game of Thrones’ plot. When it comes to giving students anxiety, statistics aren’t far behind math. In fact, statistics is a mathematical science, even though not a subfield of math. Statistics seems deceptively simple until you’re faced with a problem of doing statistics homework yourself, such as chi-square test.
Let’s start! Read everything if you need to understand the idea of chi-square and put something in the “Method” section of your paper. If you are already in the loop of statistics, scroll to Chi-Square Test Guide at the end of this article! This article includes:
Contents (Clickable)
❓ When to Use Chi-Square Test — and What Is It, Actually?
First things first, it’s important to know what you’re dealing with. The key thing to remember is that the devil isn’t as black as he is painted. Chi-square test is a common statistical method used to determine whether two things (in statistics they are called variables) are somehow related.
How can you apply this to everyday life? Super intimidating and multilayered formulas in statistics often seem to be detached from reality. However, you can actually use this method to figure out if any two things depend on one another. That is, if one thing changes, another one reacts in some way.
Here is an example of a case that chi-square test can resolve.
Imagine that your mood depends on whether you have coffee in the morning or not and you’re pretty sure it does. To make sure that your assumption is true, you make an experiment. For 2 weeks, you record your mood and whether you had coffee that day. So, let’s assume that out of 2 weeks you had coffee 8 days and felt well 7 of those 10 days. You also skipped coffee for 6 days and felt well for 4 days.
Using chi-squared method will help you make records (see how data is organized in tables in the following part of the article) and evaluate if your assumption is actually right.
| Have coffee | Skip coffee | Total | |
|---|---|---|---|
| Feeling well | 7 | 4 | 11 |
| Feeling not so well | 1 | 2 | 3 |
| Total | 8 | 6 | 14 |
There are four main criteria that define whether the test can be used. Check them cautiously!
- You need to analyze numerical survey results or observation results – specifically, you are to analyze the numbers of times you’ve observed something happening or collecting the same response. For example, you’ve asked 100 people (51 women and 49 men), 25 women or 29 men choosing coffee is a numerical result, the frequency of choosing coffee among women.
- Variables are categorical — for every variable, there are some groups you can distinguish. For instance, respondents in surveys can be categorized by gender, age, political views, etc.
- There are two individual variables (e.g. gender (male, female) and soft drink preference (Coca-Cola, Pepsi, Sprite, Mountain Dew, or Fanta)
- You only need a yes or no answer – chi-square can only tell if two variables influence each other, not how strong the influence is and when or why it occurs.
On the one hand, the chi-square test will help you determine whether the variables are related. On the other hand, this test doesn’t tell you how closely variables are related — it only confirms or rejects the possibility of such a relationship. In addition, the larger the sample size is used, the lower the risk of error is. Still, chi-square is more tolerant to the size of the sample than other methods.
Chi-square is difficult only until you put it in the practical context and use real-life examples of its use. Chi-square can be used in a variety of fields to reveal the relationship between two variables. For instance:
- In healthcare: are diseases associated with exposure to radiation?
- In sociology: is crime rate related to the education level of offenders?
- In marketing: do sales depend on the region where products are sold?
- In politics: does voter turnout depend on voter age?
So, now you know basic mechanics of chi-square test and ready to explore details!
⁉ Why Pearson’s Chi-Square Test is Thought So Difficult?
There are several key reasons why students struggle with the chi-square test, including:
- This method is confusing when studied without illustrative examples – complex formulas are overwhelming for any student who’s just starting to study statistics.
- Extremely complex definitions and explanations that don’t let students truly get the essence of this test – chi-square method, as explained in textbooks, seems very complex until you get to the bottom of it.
- Lack of time teachers can devote to explaining every topic – students often need to do the additional research themselves and have no one to ask for an extra explanation.
- Lack of knowledge due to that your major doesn’t have anything to do with statistics. If student’s major doesn’t include the even minimal course in statistics, then chi-square is all Greek to them. However, students in nursing, management, criminal justice, and education are often assigned with term papers and theses that require the use of statistical methods.
That is why I decided to write this article — everything can be explained in human language, which is the mission of the Homework Lab. Let us basic things you need to know about chi-square:
Besides, if you need to learn more about statistics, check the list of recommended resources by Homework Lab. They are free, accessible and don’t abuse complex terms and concepts, which facilitates learning.
Learn More1Categorical data can be displayed in contingency tables.
Contingency tables present observations in matrix format – rows and columns, just like the table above. This type of tables is very commonly used in statistics, especially because it demonstrates how two variables are connected.
2The essence of chi-square test is comparing observed data (what actually happened) to expected data.
The latter is calculated under the assumption of no association between variables.
Expected value shows how the numbers would be distributed in the table if there would be zero connection between variables. Using our example, expected variables would present what the numbers would be like if there would be zero connection between drinking coffee in the morning and feeling well or not so well.
3Chi-square test is non-parametric, meaning that its distribution is free.
This means that the data isn’t normally distributed – you know that the things you’re analyzing are under the influence of some factors.
In our example, we don’t specify the type of coffee you drink every morning or when exactly you drink it. There’s also no specific definition of what you consider as ‘feeling well’ or ‘feeling unwell’ because that you can’t interpret your perception in a numerical way. Hence, your observations don’t all have the same parameters, which makes it non-parametric.
In addition, this method works well for small sample size, when you need to use all the data and can’t increase the sample just to make it meet the parameters. This is useful for nursing and healthcare clinical case studies, where you cannot attract more patients to the hospital — and do not want to 😜.
4 Chi-square test only checks whether two variables are related in a binary format, meaning that the answer will be answered in ‘yes’ or ‘no’.
This means that the test can only tell you whether two variables are related (yes) or that they don’t influence one another in any way (no). If you want to find out how much variables are related, or evaluate how strong the connection is, then correlation analysis will be a much better choice for you here. The guide on correlations will be here soon, so don’t forget to subscribe!
5Chi-square test only uses frequency counts.
Thus, you’re limited to using only numerical values. Simply put, chi-square is calculated numerically. Each of the observed numbers in the test table reflects how many times a certain thing happened.
For instance, in our coffee example, we calculate how many times you feel well after having coffee in the morning and how many times you don’t feel that well after having coffee. The numbers in the table can’t represent years, mood ratings, questionnaire scores, etc.
You can come up with any categories of variables. However, the numbers in the table always answer to the question ‘how many times did I observe this?’ or ‘how many respondents in the survey answered this way to the question?’
➗ Formula and Key Calculations of Chi-Square Test Explained
Right off the bat, you should know that it’s totally acceptable for non-statistics students to skip doing all the calculations manually and use online statistics tools. At the end of the article, you’ll find several great chi-square calculators that’ll help you avoid all the hard work — don’t be afraid to scroll!
Nevertheless, whatever method you use, it is still important to know how chi-square test work, so you could interpret the results correctly. Also, I know that some college professors require formulae to be explained. We’ve included them as pictures so you could paste them in your paper 🖖.
Many students feel intimidated by this formula. Hey, look how awkward it is!
\[ {\chi}^2=\frac{1}{d}\sum_{k=1}^{n} \frac{(O_k – E_k)^2}{E_k} \]
Or, you can also write this formula down as follows, which is already much less intimidating:

where
- χ2 — the value of chi-square
- Σ — a sign of sum, means the total amount of elements in a sequence
- O — the observed value of a variable, or the numbers you already have from observations or task description
- E — expected value of variables you need to calculate yourself; they represent how the variables would be distributed if there would be NO relationship between the variables
To calculate expected values you need to use the following formula:
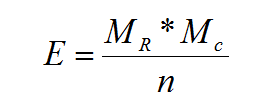
where
- E — expected value
- Mr — row marginal for the cell you’re calculating an expected value for
- Mc — column marginal for that cell
- n — sample size
In the next section of this article, you’ll see these two formulas in action. Once again, if you can skip manual calculations, such tools as Excel or SPSS will do all the hard work for you.
Did you know that Homework Lab is a student task sharing platform? You can work on tasks on your own or ask professional Geeks for help. Join anytime, anywhere for free.
Learn MoreNow let’s consider some key concepts you need to know before moving on to the chi-square test example:
- A degree of freedom (df) – the number of independent variables that went into the calculation. You might not realize it, but you’ve experienced degrees of freedom many many times before – as a consumer! Just think of those promotions “buy 2 – get 1 for free!” – these are perfect examples of how you’re free to choose several things, but that +1 product is always set by the promotion. This example also shows that the number of degrees of freedom is calculated as the sample size minus 1 (df=n-1)
- Statistical significance – the likelihood of that the relationship between two or more variables is not accidental. For instance, you hit a corner with your finger and feel pain, the statistical significance of their relationship is 1, or 100%. In turn, if you hit a corner with your finger and aliens commence the attack, the significance of the connection between these events is 0. Confidence and significance are closely connected. If you are 95% confidence that the aliens commence the attack because you hit a corner with your finger (what if ‘attack us’ button was there?), then the level of confidence would be 0.95, while the level of significance would be 0.05 (95%+5%=100%)
- Chi-square test table – a table that contains observed and expected values for chi-square calculation
Observed value shows what actually happened, or how many times you’ve observed something occur. Expected value shows what would happen if the two variables would have no influence on one another whatsoever.
- Sample size – the number of observations. How many times did you hit a corner with your finger? How many people responded to your survey? Your sample size is the number of times you’ve observed something during the experiment.
📋 Chi-Square Test Example and Step-by-Step Guideline
The best way to show you how the chi-square test is used is to illustrate each step with an example.
Example Case. Let’s presume you’ve surveyed 100 people asking whether they voted during the last Presidential elections or not. There are two categories of respondents by age — one category is from 18 to 35 and another one from 36 to 50. There are also two categories of voting: “Votes” and “Doesn’t Vote”
Without further ado, let’s begin!
1Create a Table and Fill In the Table Categories
In the example case, the table is a 2×2 contingency table — two rows for age categories, two columns for voting behavior.
We’re adding one additional row for calculating sums of rows and tables:
| Votes | Doesn't vote | Total | |
|---|---|---|---|
| Age 18-35 | |||
| Age 36-50 | |||
| Total |
2State Statistical Significance
For this example, we choose the level of significance as α=0.01 for future calculations. If in your particular example the level of significance isn’t specified, you can choose it yourself. The more you are certain about what variables are related, the lower the value of the level of significance you can pick. The lower the value, the more significant results you’ll get because lower significance will result in lower risk of error.
Note: If the significance level isn’t given in your task, you can choose it by yourself. The most common pick is 0.05, another good choice is 0.1 — both are used by professional researchers and 100% safe.
How to understand the level of significance?T Significance indicates the risk of coming to the conclusion that two variables are somehow related when in reality they aren’t. That is why this number is so small – statistics love correct conclusions.
Imagine that you have a fence that holds a herd of sheep together. In our example, the level of significance is the number of holes in the fence. The more holes the fence has, the higher is the risk that more sheep will escape! Our two variables here are the number of sheep that escape and the number of holes in the fence.
3State the Hypotheses
There are two types of hypotheses (you can refer to them as chi-squared test assumptions) you need to know – null and alternative.
In the example, we have the following hypotheses: H0 and H1
Null hypothesis usually states that the results of the observations could result purely from chance and the variables are independent – if one of them changes, another one stays the same and doesn’t react to the changes in the first one.
H0 – null hypothesis. In our case, it means that voter age and voter turnout are independent, meaning that the variables aren’t related
Alternative hypothesis states that the sample observations result not from a random cause, but from a specific cause and the variables are dependent in some way.
H1 – voter age and voter turnout are dependent
Basically, the null hypothesis rejects the idea that variables are related, and the alternative hypothesis confirms it. Your statistical test will inevitably prove one hypothesis or another.
4Fill In Observed Values
Each of your 100 respondents can fall into only one category, meaning that the sum of 2×2 rows and columns should be 100.
| Votes | Doesn't vote | Total | |
|---|---|---|---|
| Age 18-35 | 24 | 31 | 55 |
| Age 36-50 | 36 | 9 | 45 |
| Total | 60 | 40 | 100 |
5Calculate Expected Values
The expected value represents the distribution of data in case if there’s no relationship between voting and voters’ age. It means calculating whether people would decide to vote or not if their age wouldn’t influence their decision:
| Votes, expected value | Doesn't vote, expected value | Total | |
|---|---|---|---|
| Age 18-35 | 33 | 22 | 55 |
| Age 36-50 | 27 | 18 | 45 |
| Total | 60 | 40 | 100 |
Let’s see how we’ve found expected values using formulas from the article.
- Expected value for age 18-35, votes: E=55*60/100=33
- Expected value for age 18-35, doesn’t vote: E=55*40/100=22
- Expected value for age 36-50, votes: E=45*60/100=27
- Expected value for age 36-50, doesn’t vote: E=45*40/100=18
6Calculate Chi-Square Using the Formula
Having the observed and expected value, we can easily calculate chi-square. If we use online statistics calculators (scroll below to see the easiest tools), we can skip all this calculation altogether and just get an answer immediately.
![]()
If you need to process a lot of data, you can use a more detailed chi-square table like this, where you’ll register every element of test calculation. It’s also a must for students with statics major.
| Observed | Expected | Observed-Expected, (O–E) | (O–E)2 | χ2=(O–E)2 /E | |
|---|---|---|---|---|---|
| Age 18-35, votes | 24 | 33 | -9 | 81 | 2.45 |
| Age 18-35, doesn’t vote | 31 | 22 | 9 | 81 | 3.68 |
| Age 36-50, votes | 36 | 27 | 9 | 81 | 3 |
| Age 36-50, doesn’t vote | 9 | 18 | -9 | 81 | 4.5 |
| Total | 100 | 100 | - | - | 13.63 |
7Degrees of freedom and critical value from the chi-square distribution table
Now that we got chi-square calculation done, let’s calculate the degrees of freedom:
![]()
The next thing to do is to find the critical value.
Critical value is the number that you’ll compare chi-square value to; you can get it from the chi-square distribution table. If your chi-square is larger than the critical value, it means that we can reject the null hypothesis (H0) and accept the hypothesis (H1) that states that variables are indeed related.
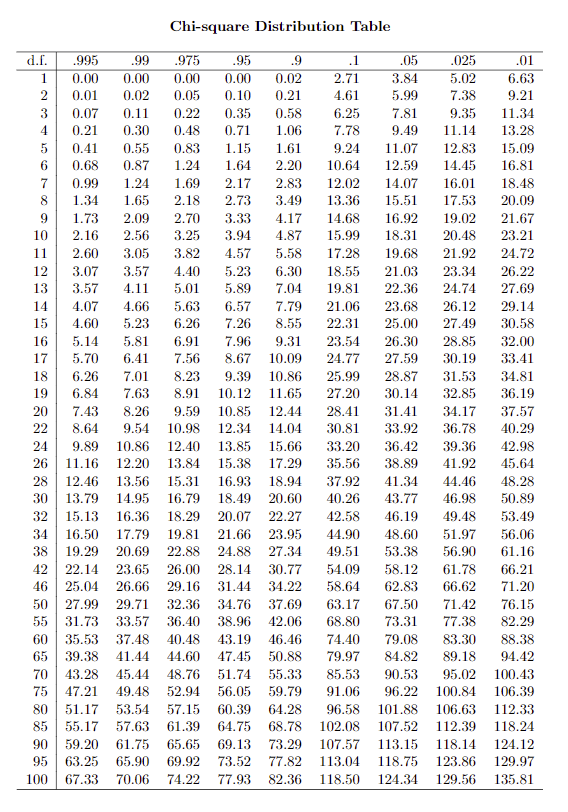
You need to use a chi-square distribution table and find your critical value at the intersection of the degrees of freedom (df=1) and the level of significance (α=0.01):
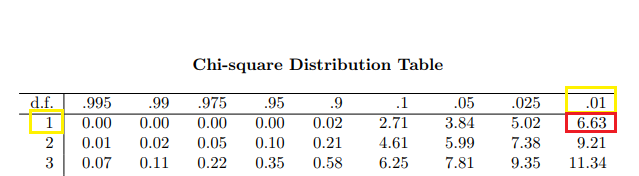
Click to see a full version of Chi-square Distribution Table (warning, large image)
So, our critical value is 6.63. This value is smaller than our χ2 =13.63 Therefore, in our chi-square test example, voter age and voter turnout are related. We don’t know how much they are related, because this test doesn’t answer this question.
Now, you are done with the test! You are really done. Repeat all these steps with your variables, and you’ll get valid and reliable results for your study. The only step you not need to repeat is manual operations — check awesome automatic tools for chi-square calculation below.
📱 Chi-Square Calculators
As I’ve said earlier, it’s totally OK to use software tools for chi-square test. In the majority of cases, all you need to put in your paper is χ2, expected value, degrees of freedom and statistical significance. Each of three tools below will help you to get all that you need!
- Social Science Statistics Calculator – easy to use chi-square calculator that has 5 rows and 5 columns. You can enter category names, fill in the data, and get the result in a flash. A simple, effective, and quick solution for your puzzling!
- Kent University SPSS Guide for Chi-Square – if you have SPSS, you can consider your chi-square test pretty much already done. This guide will help you learn how to import chi-square tables and graphs into the SPSS and get the task solved. Many colleges and universities use SPSS as their default tool, and your professor may ask you to show your SPSS datasheet.
- Real Statistics Using Excel – this guide will help you use MS Excel for calculating chi-square. Unlike two previous tools, Excel does not have built-in chi-square testing functionality. Hence, it involves some formulas and typing in the numbers, but it’s still better than calculating it manually, right?
👌 Cutting the Corners: Pro-Test Tips
Now, you can successfully complete a simple chi-square test, which is pretty enough for the majority of statistics-related assignments. Still, there is a list of issues that you may still have after reading this guide.
- You have more than two categorical variables and have difficulties building the table.
- Your data is not categorical and you need to transform it for chi-square test without losses.
- You need to conduct homogeneity or one-sample chi-square test.
- When calculating the expected value, you’ll most likely get fractions, which can confuse you
In these cases, there is no one-size-fits-all solution. Still, you may get in touch with our Geeks. There is always a statistics expert online, whose specialty is figuring out complex cases and helping students with non-statistics majors to conduct their projects.
Oh, and check pro tips below — they work every time and will definitely make your chi-square task much easier.

Share your task and the right geek will check it immediately
- Keep in mind that chi-square isn’t rocket science – it is doable and actually very easy if you have a really simple and detailed guideline
- The number of categories can vary and your tables can be much larger than the one in the example. However, the principle remains the same – you’ll just need to do more arithmetic
- If you are a visual learner, definitely incorporate the chi-square graph into your work
- Make a glossary where you explain statistics concepts and definitions in simple terms, including simple explanations on how to calculate them
- When calculating the expected value, you’ll most likely get fractions, which can confuse you, especially if you’re calculating the number of people in each category. Don’t bother about it – these calculations are intended for further calculation of chi-square test.
That is all for today! If you think that I should update the article with some additional tips, drop into the comments below 👇! Feedback will make me feel proud — a kind of “thank you” that is easy for you to say.
Related articles


Popular articles


